Nansen’s ship Fram

I am in Longyearbyen on Svalbard, the Norwegian archipelago at around 80 degrees North.

On my way to Svalbard I spent a day in Oslo.  I visited the Fram Museum and saw the polar expedition ship that I had read so much about. It’s rests in a dry dock on the peninsula of Bygdøy, housed in a triangular-tent-shaped building where one can circle the ship whilst reading about polar expeditions past.

The Fram

The Fram

Read more

Anticipating Aurora & Eclipse

“You should be here earlier in the winter. When it was colder,” said Knut, the Sami reindeer herder in his gruff, accented English. “Now it’s warm weather, rain, we can’t see the northern lights.”

“We haven’t seen them at all since I’ve been here,” I replied. “That’s nearly a week. It’s been cloudy every day.”

“When it’s so warm it [the northern lights] doesn’t come.”

“When is the best time to see it?”

“December or January. When it’s very cold.”

We were out in the hills with the reindeer somewhere around Karasjok, a few hours’ drive inland from Alta, near the Norwegian–Finnish border. That was March last year. I was in northern Norway researching a book I am writing on the northern lights. I am a plasma physicist and the aurora is plasma, so despite my academic interests in nuclear fusion (I was the IOP Schools’ Lecturer in 2010 on this subject), the northern lights have long fascinated me. Read more

Insulation 2 – a different lesson

Mountain Science – preliminary results 5

This post is about an experiment I did that gave quite unexpected results.

As well as looking at insulation of particular fabrics, as in the previous blog, I wanted to have a look at the insulating properties of some of my stuff – my socks and gloves.  I did this using a Raspberry Pi.  Anyone with a Pi can set theirs up so they can do this too.  If you do, please share your results with me.

The Raspberry Pi was set up with a temperature sensor and a real-time clock.  For information on how to do this see http://www.raspberrypi.org/learning/temperature-log/   When plugged in to a battery it boots up then takes temperature readings every ten seconds for 500s in total.  Then it turns off.

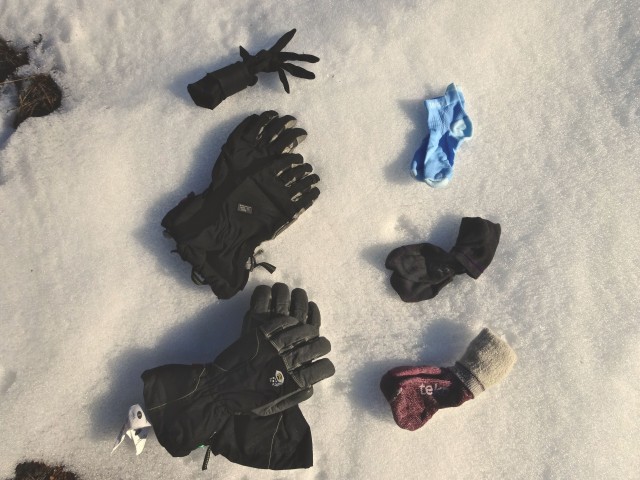
I did the experiments when I was confined to my tent during the snow storm on the way to Putha Hiunchuli.  Below is a picture of the items I tested: three pairs of Teko socks (thin, medium and thick); two pairs of Mountain Hardwear gloves (medium and thick); and a thin pair of silk liner gloves.
DSC00770

The experiment involved putting the warmed Raspberry Pi in a sock or glove, turning it on and putting the ensemble out in the cold while it took readings.  The Pi was warmed in my sleeping bag between readings.  This kept me occupied for most of the afternoon while we were snowed in.

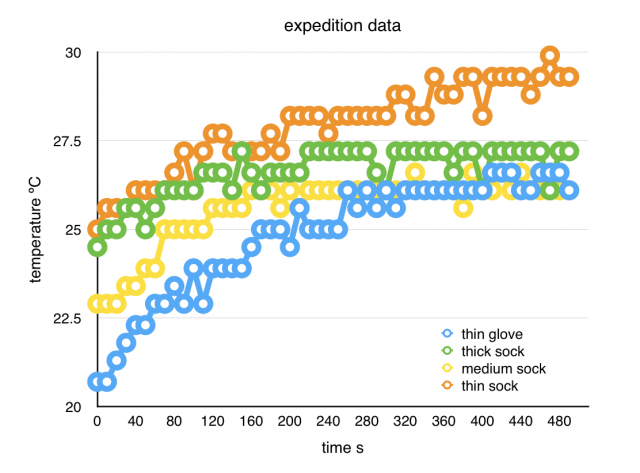
When I returned to England I downloaded the data from my Raspberry Pi.  Unfortunately, not all the runs had saved properly, but what I have is plotted below.  Do you notice anything odd about this graph?  Would you accept these results?
Insulation Pi tent 2

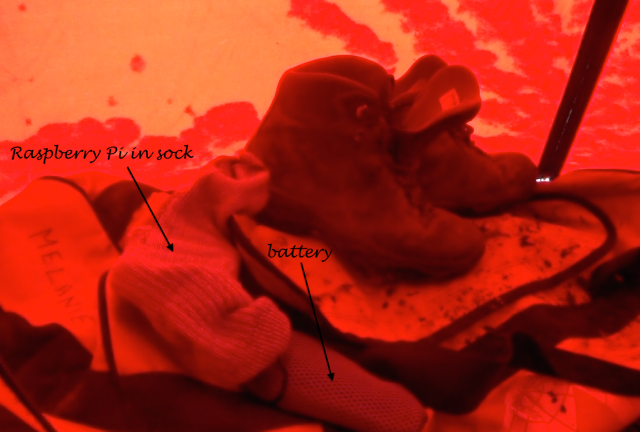
Yup, it’s going the wrong way.  In the tent porch, according to this data, the Raspberry Pi was warming up not cooling down.  Hmmm.  This is a mystery.  I still don’t know why this happened.  Was the Pi placed too close to the battery and the battery heating up?  (See picture below of the grubby experimental conditions.)  It seems unlikely, but I have no idea why the porch was warmer.
Pi exp in tent

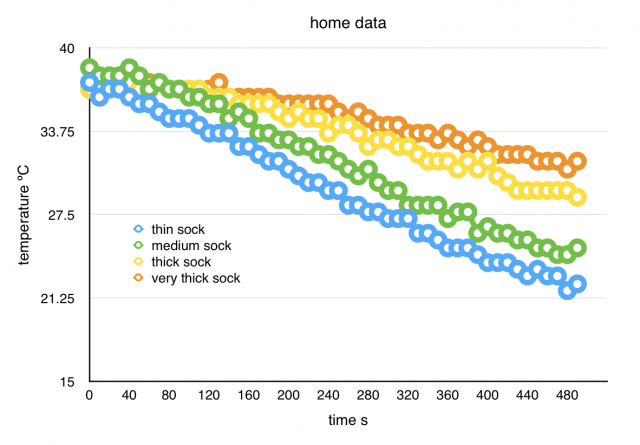
I repeated the experiment at home, this time putting the Raspberry Pi in the freezer as it took readings.  At home the Pi was in the bottom drawer of the freezer and the battery hanging outside so it couldn’t affect the Pi.  I did it just with socks this time, adding a very thick Teko expedition sock.  The results are below.
Insulation Pi home 2

These data look a bit more like we would expect – the Raspberry Pi is getting colder!  We can also see that the thicker the sock the warmer it kept the Pi, .i.e. the better the insulation.  The thicker socks trap more air, as discussed in the previous blog, so they keep our feet warmer.

This experiment is interesting because it teaches us to think about what we expect and not to accept the data blindly.  Repeat the experiment if necessary.  I should really do this one again somewhere else and compare my findings.  If anyone else does reproduce this experiment, please share!

Thanks to Zoltán Szenczi and to my sponsors:

Logo_stitch_final

Insulation

Mountain science – preliminary results 4

This experiment looks at the insulation properties of three different fabrics – cotton, primaloft and down.

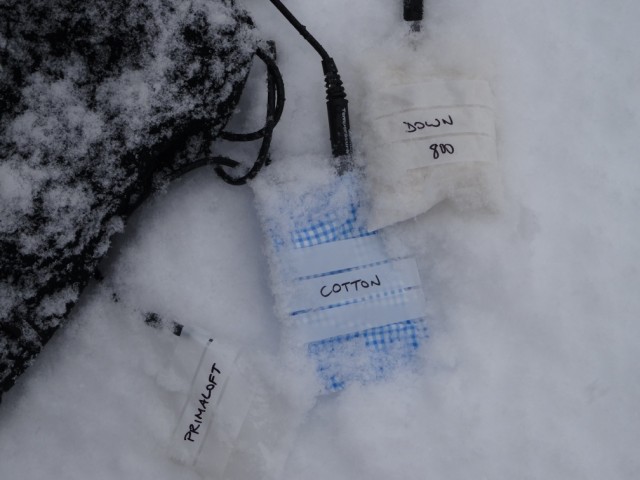
I did a simple test with my Vernier data logger and some samples.  I set the data logger up with three temperature probes and instructions to record the temperatures every 10 seconds for 20 minutes.  I placed a two-layer sample of each material in its own small plastic bag (except the down, which was just a load of feathers).  I then pushed one temperature probe into each bag between the layers of fabric or into the feathers so that it was completely surrounded.  I pressed record on the data logger and put it all out in the snow for about 20 minutes.

DSC00969

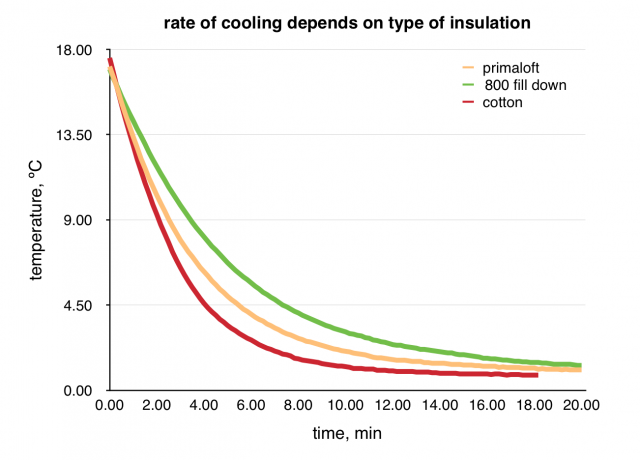
Later, when I downloaded the results to my computer, this is what I found.

Insulation FR 2

We can see here that the down is the most insulating material, followed by the primaloft, followed by the cotton.  Someone wearing just cotton would cool off quickly in the snow, whereas wearing primaloft or, preferably, down clothing would keep them warmer for longer.  This is because what actually keeps us warm is trapped air, and down traps the most air – caught between all the fluffy parts of the feathers.

One of the main ways that humans lose heat is by conduction.  In the same way that a metal spoon left in a piping hot drink will soon become hot to the touch, heat is conducted through any medium by hot, rapidly-moving atoms jiggling around and hitting into colder, slower atoms and causing them to jiggle faster, so transferring the energy.  Metal is a good conductor, meaning that heat energy transfers quickly through this medium.  Sitting on a metal bench in the cold will cool you down faster than just sitting in the snow.  Water is also a good conductor, which is why you will cool down quickly even in a warm swimming pool if you stop moving.  If you fell into freezing water and couldn’t get out you would likely be dead within ten to fifteen minutes.  But air is a relatively bad conductor, so trapping lots of warm air close to our skin keeps us warm.  This is why layering clothes is effective, with a small amount of air trapped between each layer.

The best insulating clothing therefore traps air.  Natural duck feather down is still the best material we have, despite creating fancy new materials.  However down is almost useless when wet, so can only be used in dry environments.  The man-made, synthetic alternative, primaloft, is not quite as insulating but it will maintain its effectiveness even when wet.  So remember, your best choice of clothing depends not only on what you will be doing, but where and in what conditions you will be doing it.

Insulation samples kindly provided by Will at Rab.  Cotton from the local haberdashery!

Thanks to my sponsors:

Logo_stitch_final

Ultraviolet radiation at altitude

Mountain Science – preliminary results 3

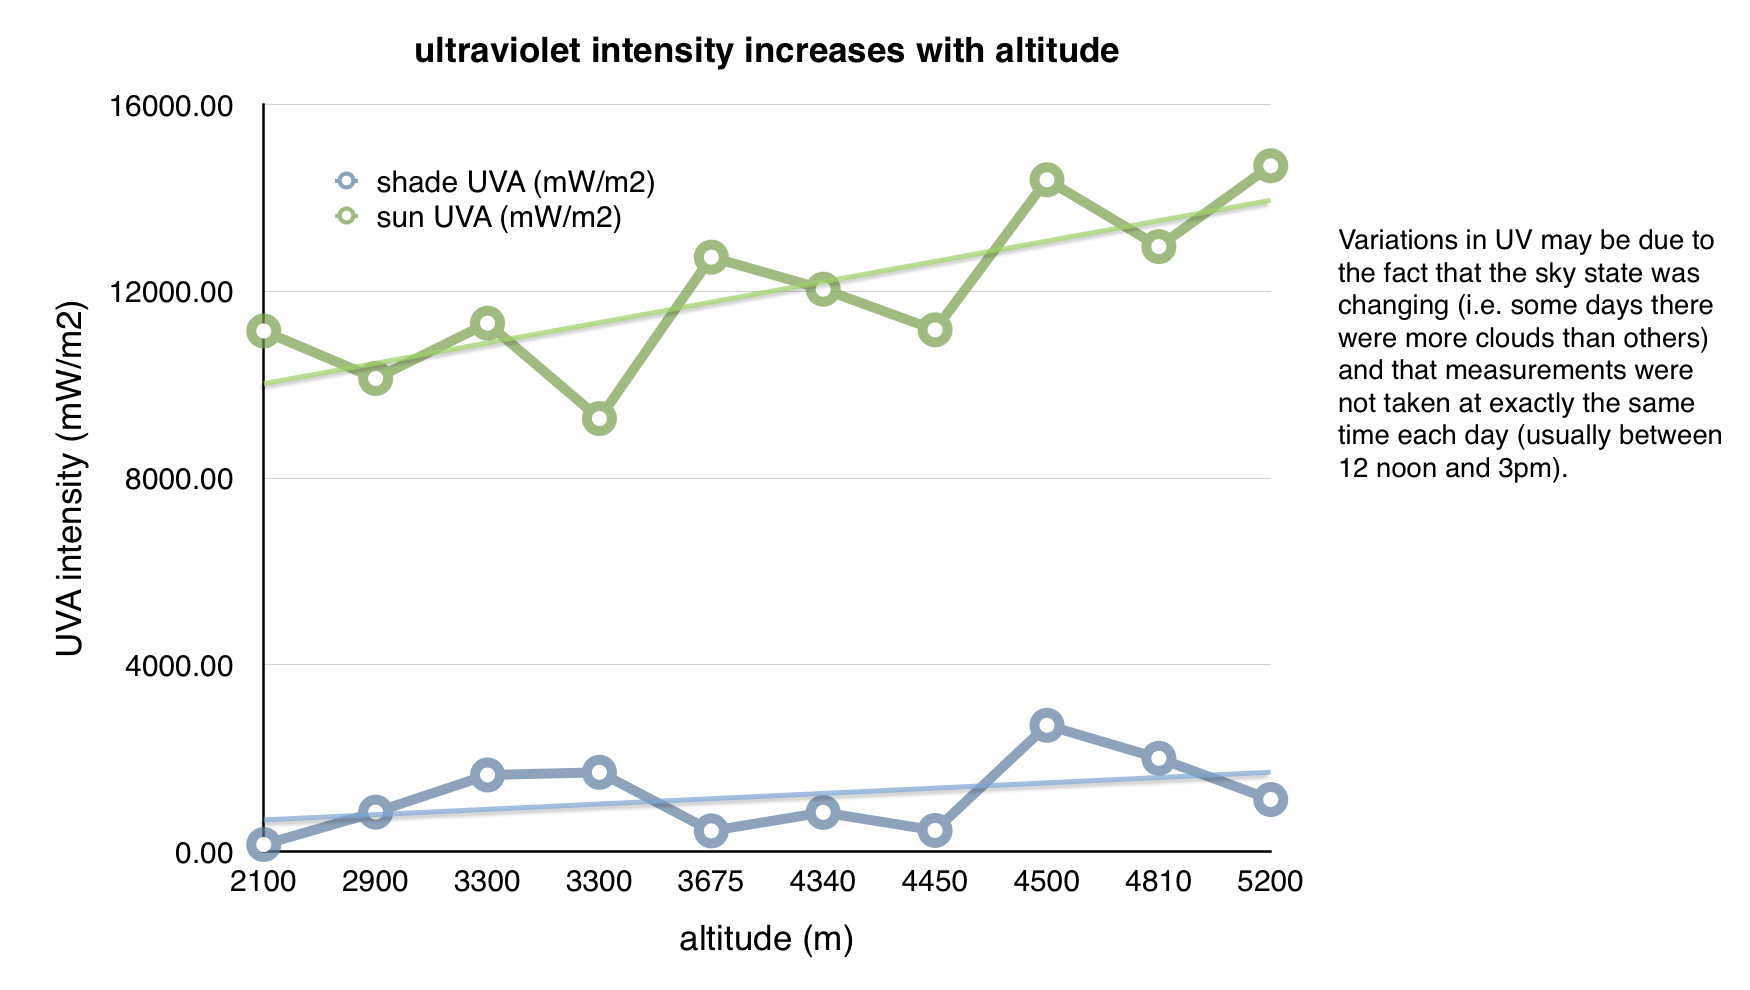
At higher altitudes, the intensity of ultraviolet (UV) radiation increases because there is less atmosphere above to absorb the ultraviolet rays.  The UV intensity also increases the closer we go towards the equator, so climbers from the UK who go climbing in the Himalayas, say, will also see an increase in UV because of the change in latitude.  Snow and sand can increase UV exposure further, particularly in shaded areas, because they reflect the UV rays.

Ultraviolet radiation exposure can lead to sunburn, premature skin ageing and skin cancer, as well as causing eye damage (e.g. cataracts), so it’s really important that climbers protect their skin and eyes at altitude.

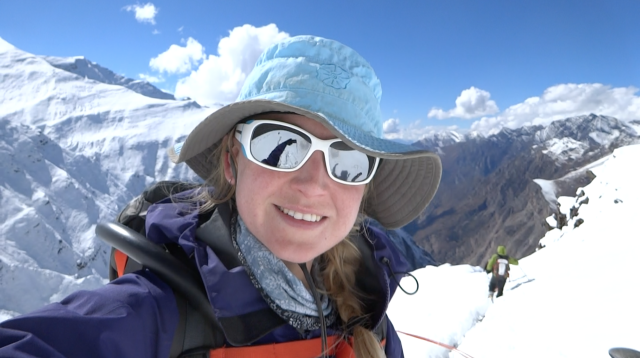
This is a picture of me wearing a hat and glacier sunglasses for protection.  I am wearing factor 50 sunscreen (and factor 30 lip balm) but still look a bit red.  I should be wearing my buff over my face to protect my lips and cheeks.

Screen Shot 2014-11-04 at 09.45.17

When I was in the Himalayas I measured UV intensity at various altitudes, see graph below.  Although there is some variation, we can see that the intensity is increasing in both the sun and the shade.

Screen Shot 2014-12-18 at 19.31.16

Since it’s so important for climbers to protect their eyes and skin whilst at altitude, I did some demonstrations using UV colour-changing beads to see the UV-blocking effect of my Julbo Monterosa glacier sunglasses.

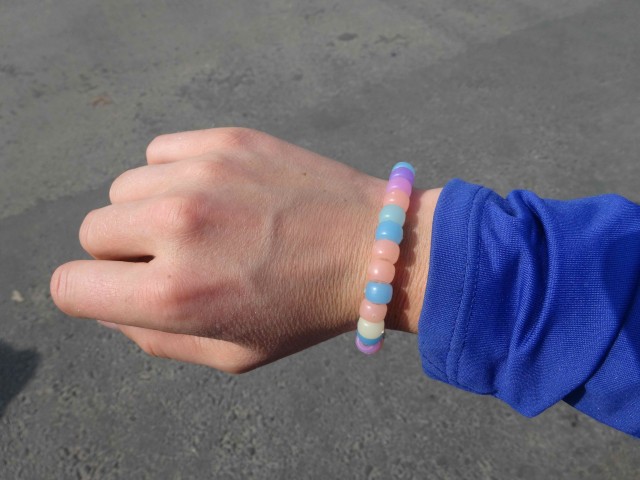
Below is a picture of the UV beads in the sun – nice and colourful.  They are white in the dark, but in the presence of UV the beads become more and more brightly coloured depending on the UV intensity.

DSC00899

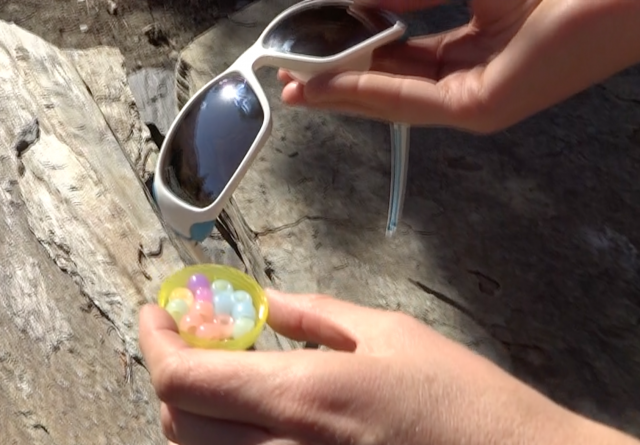
I put some beads in two pots and left them in my sunglasses case, out of the sun, to turn white.  When I took them out of the case I kept one protected by the glass of my glacier glasses and the other was exposed to the sun, as in the picture below.  I left them like this for several minutes.

Screen Shot 2014-12-18 at 18.02.04

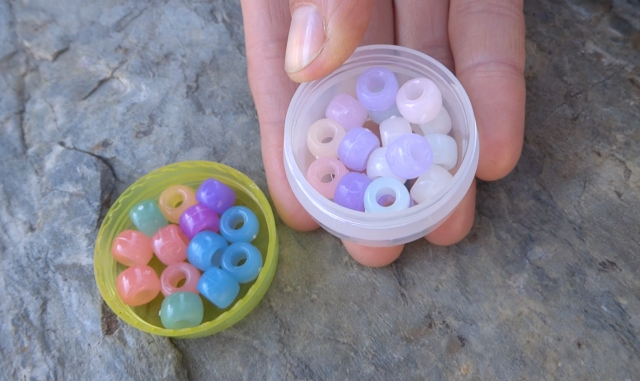
Then I moved the sunglasses away and looked at the difference in the beads, see below.  The beads protected by the sunglasses were barely coloured at all (the colour creeps in quickly when the protection is removed) whereas the ones that had been in the sun were very bright.  At least this shows my Julbo glacier glasses were working!

Screen Shot 2014-12-18 at 17.57.20

Julbo have several presentations on their website on the importance of eye protection.  For more information on UV radiation and sun health see the US Sunwise program and the UK Met Office.

Alongside Anturus I am making some videos of these experiments as educational resources, but these are some first results.

Thanks to my sponsors:

Logo_stitch_final

Reduced air pressure & the body

Mountain Science – preliminary results 2

In the last blog we looked at how air pressure reduces at altitude and the effect this has on the boiling point of water.  This reduced air pressure also has a serious effect on the human body.

Reduced air pressure means that there is less oxygen available to the body.  There is still the same proportion of oxygen in the air (almost 21%) but the air pressure is lower so there are fewer air molecules per fixed volume of air.  This means that for every lungful a climber breathes there will be fewer oxygen molecules going into the bloodstream.

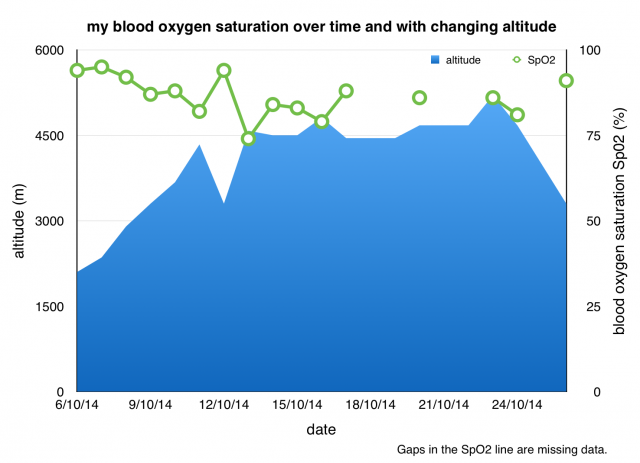
Doctors measure something called oxygen saturation (the concentration of oxygen in the blood).  Below 90% is considered low, and at sea level people with oxygen saturation this low would probably be sent to intensive care.  The interesting thing is that bodies can adapt to low oxygen environments and most climbers at altitude will have oxygen saturation levels below 90%, as I did for most of the time on my trip (see graph below).

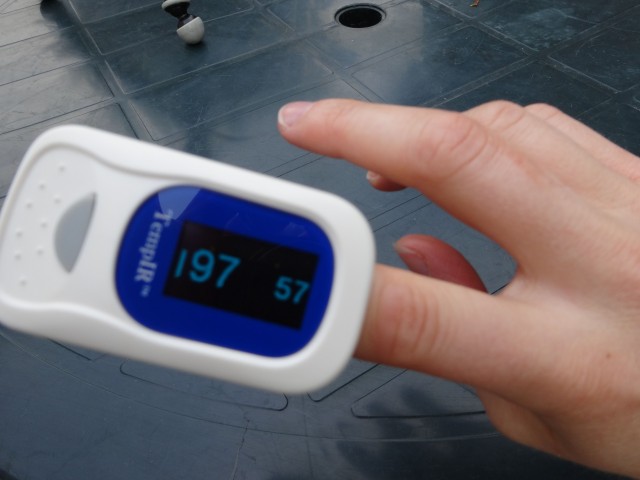
Blood oxygen saturation, also called SpO2, can be measured using a little device that fits on our finger, called a pulse oximeter.  This picture below is me measuring my SpO2 at home before I left for the mountains.  You can see my SpO2 was 97% then.  The 57 is my heart rate.

DSC00502


The graph below shows how my blood oxygen saturation varied during the climb.  The blue “mountain” shows the altitude and the green points are my SpO2 measurements.  They are not tremendously accurate, but they give a clear picture of how changes in altitude affect the oxygen in the blood.

Screen Shot 2014-12-17 at 10.27.54


In general, my SpO2 correlates quite nicely with the altitude.  At the beginning of the trip as we ascend the oxygen saturation in my blood goes down.  When the altitude drops my SpO2 goes up (e.g. around 12/10/12) and then drops again as we ascend further.

Unfortunately there are some data missing from the second half of the trip so we don’t get to see if my SpO2 increased as I acclimatised during the spells at a fixed altitude.  However, acclimatisation aside, it is clear that the reduction in air pressure at altitude has implications for our body.  The oxygen saturation in our blood – the oxygen available to our cells to keep the body alive – reduces as we go higher.

It is really important to be aware of this effect because oxygen is essential for our survival.  Every year people die of altitude sickness in the mountains when their bodies don’t get enough oxygen.  This can cause fluid on the lungs and on the brain, which can be fatal.  Mild symptoms are headache, nausea and fatigue.  Most people will experience mild symptoms, but if they are very bad or if you experience breathlessness at rest or confusion, clumsiness or stumbling you should go down immediately.

For more info on air pressure and oxygen levels, and for advice on climbing and altitude sickness, see altitude.org.  Also have a look at the Centre for Altitude Space and Extreme Environment Medicine (CASE Medicine) where they study the medicine and physiology of extreme environments.

Alongside Anturus I am making some videos of these experiments as educational resources, but these are some first results.

Thanks to my sponsors:

Logo_stitch_final

Air pressure at altitude

Mountain Science – preliminary results 1

I’ve recently been looking over the data I took while on expedition to Putha Hiunchuli in Nepal.  The plan was to take some data and do some experiments looking at basic science in the mountains, particularly around issues that affect climbers.  The main topics were:

  • reduced air pressure at altitude
  • increased ultraviolet radiation at altitude
  • reduced temperature at altitude

Alongside Anturus I am making some videos as educational resources, but here are some first results.

Air Pressure


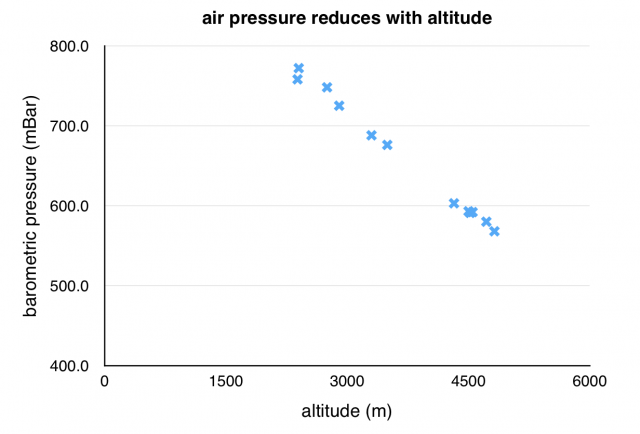
Screen Shot 2014-12-18 at 20.25.26

Air pressure reduces with altitude.  That is, the mass of air pushing down on us is less as we go higher.

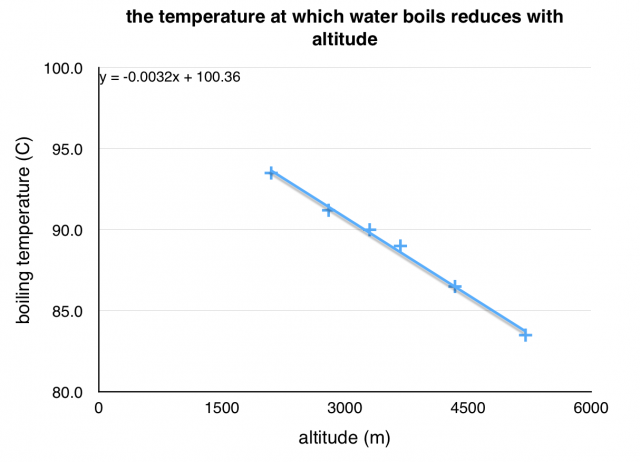
To look at the effect of this, I did something we do every day – I boiled some water.  We all know that at sea level water boils at 100 ºC, but look how this changes as we go higher.

DSC00630

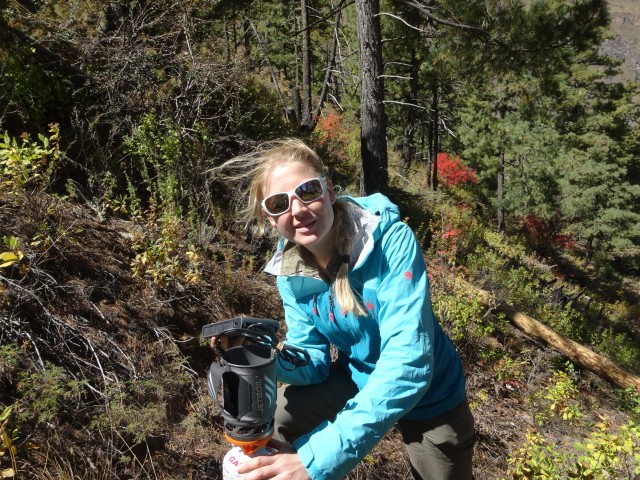
Above is a picture of me with my Jetboil and my data logger up at 3675m measuring the temperature at which the water was boiling.

Screen Shot 2014-12-15 at 08.26.27

The temperature at which water boils reduces with altitude because the air pressure reduces.

Liquids turn into gases when they are heated because that heat energy is transferred to the particles of the liquid and causes them to move faster. When they are moving fast enough, the particles near the surface can escape into the air and become a gas. When a lot of liquid particles are escaping and the temperature stops rising we say the liquid is boiling.

However, in the air there are air particles that are pushing down lightly on the liquid and making it harder for the liquid particles to escape. A lower air pressure means there are fewer of these air particles pushing down on the surface of the liquid, so it is easier for the liquid particles to escape, so we don’t need to apply so much heat. Therefore the water boils at a lower temperature.

The way that water boils at a lower temperature is a demonstration of the affect of this lower air pressure. It can be a problem for climbers because they need to rehydrate their instant mountain food using boiling water. Water at 80 ºC doesn’t rehydrate food properly.

However, this reduced air pressure at altitude has a much more serious effect on the climber’s body – reduced oxygen.  I’ll show some results on this in the next blog.

Thanks to my sponsors:

Logo_stitch_final